
The Acoustic Void: Engineering Reliability in Ultrasonic Level Sensing Amidst Complex Multi-Phase Media
1. Introduction: The Invisible Barrier in Industrial Automation
In the precise world of industrial automation, the measurement of liquid level stands as one of the most critical process variables. From the vast reservoirs of municipal wastewater treatment plants to the sterile, stainless-steel fermenters of the pharmaceutical industry, the ability to accurately determine the volume of liquid in a vessel is paramount for inventory management, process control, and safety systems. For decades, ultrasonic level sensing has served as a cornerstone technology in this domain. Prized for its non-contact nature, mechanical simplicity, and cost-effectiveness relative to nucleonic or radar alternatives, the ultrasonic sensor has become the default specification for general-purpose level monitoring.
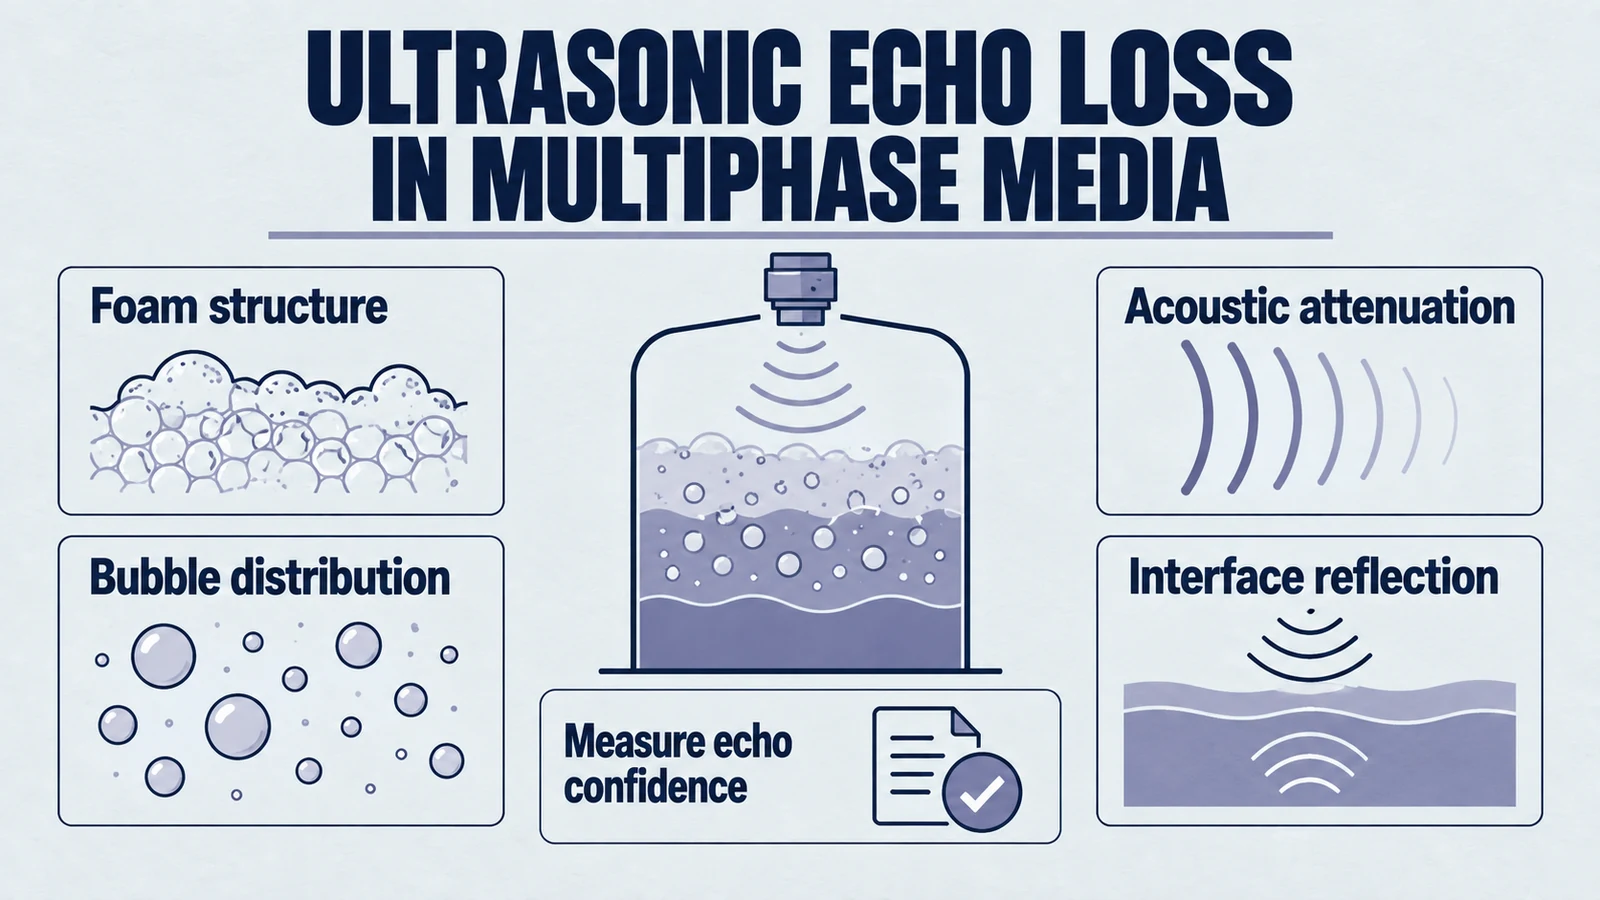
However, for the Original Equipment Manufacturer (OEM) designing the next generation of sensing equipment, or the automation engineer retrofitting a problematic chemical reactor, ultrasonic technology presents a distinct and often frustrating vulnerability: its severe performance degradation in the presence of surface foam. This phenomenon is not merely a nuisance; it is a fundamental failure of the measurement principle rooted in the complex acoustic physics of multiphase media. When an ultrasonic pulse encounters a layer of foam, the sensor does not merely lose accuracy—it often loses its "vision" entirely, reporting loss of echo (LOE) errors, or worse, reporting hazardous false levels that can lead to tank overfills and environmental contamination.
This report aims to deconstruct the "foam problem" with rigorous engineering detail. We will move beyond the superficial explanation that "foam absorbs sound" to explore the thermodynamic, mechanical, and signal-processing mechanisms that render foam an acoustic metamaterial capable of defeating even the most sophisticated time-of-flight algorithms. By understanding the interactions between piezoelectric transduction, impedance mismatching, Minnaert resonance, and Mie scattering, designers and engineers can make informed decisions about sensor selection, installation, and the fundamental limits of acoustic metrology in wet industrial environments.
Product path for this search intent
Match the article topic to the right YJ Piezo product page
Use this article when sensor performance depends on target distance, beam angle, housing material, liquid behavior, or false echo control. For "The Acoustic Void: Engineering Reliability in Ultrasonic Level Sensing Amidst Complex M...", the practical value is in turning the topic into a measurable selection or sourcing decision.
- Ultrasonic Sensors
Distance, level, and detection sensor portfolio
- Flow Measurement Transducers
Bubble and flow-related ultrasonic sensing paths
- Air Acoustic Transducers
Air-coupled transducers for range and presence detection
1.1 The High Stakes of Measurement Failure
The implications of sensor failure in foaming applications are severe. In the biotechnology sector, the "krausen" or foam head on a fermentation tank is a sign of healthy biological activity, yet it obscures the liquid level below. An ultrasonic sensor reading the foam surface as the liquid level may trigger premature antifoam injection or halt the feed prematurely, altering the batch chemistry. In wastewater treatment, specifically in anaerobic digesters, the formation of Nocardia foam can create a thick, crusty layer. If an ultrasonic sensor locks onto this crust while the liquid level drops, discharge pumps may run dry, leading to cavitation and mechanical failure of capital equipment.
Furthermore, the troubleshooting process for these failures is often counter-intuitive. Operators frequently attempt to increase the "gain" or sensitivity of the sensor, only to find that this exacerbates the issue by amplifying the acoustic noise floor generated by the bursting bubbles themselves. To navigate these challenges, one must first understand the ideal operation of the ultrasonic transducer and then analyze how the introduction of a cellular foam structure destroys the necessary conditions for measurement.
2. The Physics of Ultrasonic Transduction and Ideal Propagation
To understand the pathology of failure, we must first establish the physiology of a healthy ultrasonic measurement system. The modern industrial ultrasonic level sensor is a marvel of electro-mechanical engineering, relying on the precise manipulation of piezoelectric materials to bridge the gap between the electronic and acoustic domains.
2.1 The Piezoelectric Engine
At the core of every ultrasonic sensor lies the piezoelectric transducer. For industrial applications operating in the 30 kHz to 200 kHz range, this is typically a ceramic element composed of Lead Zirconate Titanate (PZT). PZT is favored for its high electromechanical coupling coefficient, meaning it efficiently converts electrical voltage into mechanical strain and vice versa.
When a high-voltage electrical pulse (excitation pulse) is applied to the PZT crystal, the lattice structure deforms, causing the face of the sensor to piston forward and backward. This mechanical displacement compresses and rarefies the air molecules adjacent to the sensor face, launching a longitudinal pressure wave—the ultrasonic chirp—into the air.
The efficiency of this launch is governed by the acoustic impedance () of the materials involved. Acoustic impedance is the product of density () and the speed of sound () in a medium:
A fundamental challenge for sensor designers is the massive impedance mismatch between the PZT ceramic and the air.
- PZT Ceramic: Rayls (kg/m²·s).
- Air: Rayls.
Without intervention, this mismatch would cause the vast majority of the acoustic energy to reflect back into the sensor body rather than propagating into the air. To overcome this, high-performance sensors utilize matching layers—materials with an impedance intermediate between ceramic and air (typically epoxy composites or syntactic foams)—to step down the impedance and maximize energy transfer. This context is vital because it highlights that the ultrasonic pulse is already fighting an uphill battle to enter the air; it has limited energy reserves before it even encounters the target.
2.2 The Time-of-Flight Principle
Once airborne, the ultrasonic pulse travels toward the target surface. The sensor switches its electronics from "transmit" to "receive" mode, waiting for the echo. The distance () is calculated using the time-of-flight () and the speed of sound ():
For this equation to hold, two conditions must be met:
- Constant Velocity: The speed of sound must be known and relatively constant along the path. In air at 20°C, m/s. However, temperature gradients, humidity, and chemical vapors can alter this velocity, requiring compensation.
- Specular Reflection: The target surface must reflect the sound wave back to the sensor. This return path requires a surface that is acoustically "hard" and relatively smooth compared to the wavelength of the sound.
2.3 The Necessity of the Hard Boundary
The strength of the return echo is determined by the Reflection Coefficient () at the boundary between the air and the liquid target. represents the ratio of the reflected pressure amplitude to the incident pressure amplitude:
Consider the ideal case of a water surface:
- Rayls.
- Rayls (1.48 MRayls).
Substituting these values:
In decibels, the Return Loss is:
This result is important. A calm water surface can act as a strong acoustic reflector because of the impedance mismatch between air and water. The sensor's gain algorithms are calibrated to expect a strong return signal from this interface. This mechanism explains why ultrasound is effective in many standard liquid applications. It also sets the stage for the failure case: foam weakens the clean impedance boundary that the measurement depends on.
3. The Anatomy of Foam: An Acoustic Metamaterial
To the naked eye, foam appears as a frothy, white layer. To the physicist, foam is a complex dispersion of gas pockets trapped in a liquid matrix, structured by surface tension. It is, in effect, an acoustic metamaterial—a structured composite whose acoustic properties are radically different from the sum of its parts.
3.1 Structural Classifications: Wet vs. Dry
The acoustic behavior of foam is strictly dictated by its Liquid Volume Fraction (), also known as wetness or density.
3.1.1 Dry Foam (Polyhedral Structure)
As foam drains and ages, gravity pulls the liquid down through the channels known as Plateau borders. The bubbles deform from spheres into polyhedrons (often Kelvin cells or Weaire-Phelan structures) separated by extremely thin liquid films (lamellae).
- Liquid Fraction: Typically to .
- Density: Very low, approaching that of air.
- Structural Rigidity: Provided by surface tension in the thin films.
- Acoustic Implication: Dry foam represents a "soft" boundary. Its acoustic impedance is only marginally higher than air, leading to high transmission (absorption) and low reflection.
3.1.2 Wet Foam (Spherical Structure)
In freshly generated foam or dynamic processes like boiling, the bubbles retain a spherical shape and are separated by thick walls of liquid.
- Liquid Fraction: to .
- Density: Significantly higher than air, acting more like a "bubbly liquid."
- Acoustic Implication: Wet foam has a higher impedance than dry foam. It creates a stronger reflection boundary, often tricking sensors into detecting the foam surface as the liquid level. This is distinct from specialized ultrasonic bubble detection sensors, which are designed to clamp onto tubing and specifically identify these gas-liquid transitions.
3.2 The Bubble Size Distribution
Industrial foams are rarely monodisperse (uniform bubble size). They exhibit a distribution of sizes that evolves over time due to coarsening (Ostwald ripening), where gas diffuses from smaller, high-pressure bubbles to larger, low-pressure ones.
- Fine Foams: Shaving cream, fire-fighting foam (Bubble diameter mm).
- Coarse Foams: Boiling reactors, soapy wastewater (Bubble diameter mm to mm).
This size distribution is critical because the interaction of sound with a bubble is frequency-dependent. The bubble acts as a resonator. If the bubble size matches the resonant frequency of the ultrasonic pulse (e.g., 40 kHz), the interaction changes from passive reflection to active absorption and scattering.
4. Acoustic Propagation in Heterogeneous Media: The Mechanisms of Failure
When an ultrasonic pulse travels from the air into a foam layer, it enters a zone of extreme acoustic hostility. The failure of the sensor is not the result of a single phenomenon but a cascade of physical interactions: Impedance Matching (Transmission), Velocity Anomalies, Resonant Absorption, and Scattering.
4.1 The Impedance Trap: Why the Echo Disappears
We established that an air-water interface reflects 99.9% of sound due to the massive impedance gap. Foam drastically alters this equation.
Effective foam impedance is not generally a volume-weighted average of the constituent impedances. In an applicable homogeneous low-frequency model, derive effective density and bulk modulus/compressibility and then use Z=ρc. Real foam can be dispersive, lossy and microstructure-dependent; shared films and channels limit isolated-bubble approximations. The following 800 Rayl example is hypothetical, not a measured value for every dry foam.
- to Rayls (depending on wetness).
- Rayls.
Calculating the Reflection Coefficient () for an Air-Foam interface:
The reflected energy () is only about 10% of the incident pulse. In contrast to water's 100% reflection, foam only returns about 10%. This means 90% of the acoustic energy transmits into the foam layer. To the sensor's receiver, which is calibrated to detect the massive echo from water, the return signal from the foam surface is incredibly weak—often below the detection threshold. The sensor "sees" through the surface, sending the energy into the foam where it is subsequently destroyed.
4.2 Wood’s Equation: The Velocity Collapse
Once the sound wave enters the foam, an even stranger phenomenon occurs. One might expect the speed of sound in foam to be somewhere between the speed in air (343 m/s) and water (1480 m/s). This intuitive assumption is incorrect. The speed of sound in a bubbly mixture often drops below both the speed in air and liquid.
This behavior is described by Wood’s Equation, derived for low-frequency sound in a homogeneous mixture:
Where:
- (Effective Density)
- (Effective Bulk Modulus/Compressibility)
In a foam, the mixture acquires the high density of the liquid (relative to gas) but retains the high compressibility (low stiffness) of the gas. The result: High Mass + Low Stiffness = Extremely Low Velocity. In certain wet foams, the speed of sound can plummet to 30–50 m/s, a fraction of the speed in air.
Implications for Sensing: While most industrial sensors reflect off the foam, if a sensor were to measure through a layer of foam (e.g., trying to detect the liquid below), the time-of-flight calculation would be wildly incorrect. A 10 cm layer of foam with a sound speed of 50 m/s would add a time delay equivalent to nearly 70 cm of air, leading to massive measurement errors even if an echo were received.
4.3 Minnaert Resonance: The Singing Bubble
The most potent mechanism of attenuation in foam is Minnaert Resonance. A gas bubble in a liquid is not a static obstacle; it is a dynamic oscillator. The gas acts as a spring (compressible), and the surrounding liquid acts as a mass (inertia).
The natural resonant frequency () of a bubble is given by:
For an air bubble in water at atmospheric pressure, the relationship between resonant frequency ( in Hz) and radius ( in meters) is approximately:
For a 40 kHz Sensor:
Bubbles with a diameter of roughly 0.16 mm are perfectly tuned resonators for standard 40 kHz ultrasonic sensors. When the ultrasonic pulse hits bubbles of this size, they do not just reflect the sound; they absorb it. The bubble oscillates violently, expanding and contracting. This oscillation converts the acoustic energy into heat (thermal damping) and viscous shear in the liquid films (viscous damping). The attenuation coefficient at resonance can exceed 100 dB/cm. This is effectively an acoustic black hole. If the foam contains a population of bubbles near the resonant size, the ultrasonic pulse is extinguished almost instantly.
4.4 Scattering Regimes: Rayleigh vs. Mie
Even if the bubbles are not at resonance, they scatter the sound wave, breaking up the coherent wavefront required for a clean echo. The type of scattering depends on the dimensionless parameter , where is the wavenumber () and is the bubble radius.
4.4.1 Rayleigh Scattering ()
Occurs when bubbles are much smaller than the wavelength (). Typical in low-frequency sensors (e.g., 20 kHz, mm) interacting with fine shaving foam. Scattering is weak and isotropic (omnidirectional). The sensor may penetrate the foam, but the echo strength is reduced by the sheer number of scattering events (diffusive extinction).
4.4.2 Mie Scattering ()
Occurs when bubble size is comparable to the wavelength. Typical in 40-70 kHz sensors ( mm) interacting with coarse industrial foam (bubbles 2-10 mm). Scattering is strong, complex, and highly directional. This is the worst-case scenario. The bubbles act as complex lenses and reflectors. The acoustic beam is essentially shredded. The energy is scattered laterally into the tank walls or absorbed, resulting in zero return signal to the transducer.
5. Signal Processing and the Illusion of Logic
Modern ultrasonic sensors, such as those from major automation brands, employ advanced signal processing—often marketed as "Sonic Intelligence" or "Echo-ID"—to discriminate between the liquid level and obstacles. However, foam introduces signal characteristics that often defeat these logic filters.
5.1 The Gain Loop Dilemma
Ultrasonic sensors utilize Time-Varying Gain (TVG) or Automatic Gain Control (AGC). As the pulse travels further, it naturally attenuates. To compensate, the sensor ramps up its amplifier gain over time (distance). In a foam scenario, the main pulse is absorbed/scattered. The sensor detects no significant echo, so the AGC algorithm interprets this as a "weak signal" condition and ramps the gain to maximum. The result is that the sensor amplifies the "noise floor"—the background acoustic hash, electrical noise, and minor side-lobe reflections. The sensor may lock onto a noise spike and report it as a level, causing the reading to jump erratically.
5.2 Algorithm Confusion: First vs. Strongest Echo
Sensor algorithms typically use one of two primary methods to select the level:
- First Echo Logic: Selects the first reflection that crosses a threshold curve. Light foam creates weak, early reflections. If the gain is high, the sensor might detect the top of the foam. This is a "valid" acoustic measurement but often an engineering failure (e.g., reporting 90% full when liquid is 50%).
- Strongest Echo Logic (Best-of-N): Selects the reflection with the highest amplitude. The foam absorbs the true liquid echo. However, echoes from the tank bottom, the agitator blades, or the weld seams on the tank wall might be stronger than the foam reflection. The sensor ignores the foam (and the liquid) and locks onto the agitator, reporting a static level regardless of the actual process state.
5.3 The Near-Field Blind Zone
Every piezoelectric transducer has a "ringing down" period after transmitting the high-voltage pulse, creating a "blanking distance" (typically 20-50 cm) where it cannot measure. In many reactors, foam is light and rises rapidly, entering this blind zone. If the foam is sticky (e.g., biological foam), it coats the transducer face. Even when the foam recedes, the residue acts as a dampener (impeding mechanical vibration) or an impedance mismatch layer, permanently blinding the sensor until it is cleaned.
6. Advanced Failure Scenarios & Case Studies
To understand the practical implications, we must examine specific industrial processes where these physics manifest as costly failures.
6.1 The Wastewater Bioreactor: Nocardia Foam
In the activated sludge process, air is bubbled through sewage. Under certain biological conditions, filamentous bacteria (Nocardia) produce a stable, brown, viscous foam. This foam dries on top, forming a rigid crust. The ultrasonic sensor reflects off this crust, reporting a high level ("Full"). Meanwhile, discharge pumps run to lower the liquid, but the sensor still sees the foam crust. The liquid level drops until pumps run dry, leading to cavitation and mechanical failure.
6.2 The CIP (Clean-In-Place) Cycle
Food and beverage tanks are cleaned by spraying hot caustic solution via high-pressure spray balls. This generates dense mist and foam, and the sudden injection of 80°C water into a cold tank creates violent air convection currents and temperature gradients. The physics of sound speed () changes by approx. 0.6 m/s per degree Celsius. A 50°C gradient introduces a massive error, while the foam/mist scatters the signal. The sensor output wanders unpredictably during the cleaning cycle, triggering false alarms.
6.3 The Fermentation Tank: CO₂ and Krausen
If a sensor uses 343 m/s while the actual uniform gas path is 260 m/s, indicated distance is 343/260 ≈ 1.3192 times actual distance, about a 31.9% over-read. A top-down level therefore reads too low. The 24.2% speed reduction uses a different denominator and is not the distance error. Gas composition, foam and path gradients still require separate validation.
7. Comparative Technology Analysis: Why Radar Wins
For the OEM designer, the solution often lies not in fixing the ultrasound, but in replacing it relative to ultrasonic sensors. The primary competitor is Radar (Microwave Level Sensing). The physics of electromagnetic waves offer a distinct advantage over mechanical sound waves in foam applications.
7.1 Electromagnetic vs. Mechanical Waves
- Ultrasound: Mechanical wave. Requires a medium. Interacts with physical density and elasticity.
- Radar: Electromagnetic wave. Propagates in vacuum. Interacts with Dielectric Constant () and conductivity.
7.2 The Dielectric Transparency of Dry Foam
Dry foam is mostly gas (air/CO₂). The dielectric constant of air is . The dielectric constant of water is . To a microwave beam, dry foam is almost transparent. The radar wave passes through the foam with minimal attenuation and reflects off the conductive liquid surface below. Radar measures the liquid level, ignoring the foam, which is often the desired process variable.
7.3 High-Frequency (80 GHz) Radar
Older 6 GHz or 26 GHz radar units had wide beam angles and could sometimes be confused by heavy wet foam. Modern 80 GHz FMCW radar sensors emit a focused beam (3-4 degree angle) that can punch through gaps in the foam or find the liquid surface with higher precision. If the foam is wet and conductive, radar will reflect off the foam surface. However, unlike ultrasound, radar does not suffer from wind/vapor speed variations, making it inherently more stable in the headspace environment.
| Feature | Ultrasonic Sensor | Radar Sensor (80 GHz) |
|---|---|---|
| Propagation Speed | Temp/Gas dependent () | Constant () |
| Foam Interaction (Dry) | FAIL (Absorbed) | PASS (Transparent) |
| Foam Interaction (Wet) | Reflects Foam Surface | Reflects Foam Surface |
| Cost | Low | High |
8. Mitigation Strategies for Automation Engineers
If changing the technology is not an option (e.g., due to budget or legacy installation), engineers can employ specific strategies to mitigate foam-induced failures.
8.1 The Stilling Well (Standpipe)
The most robust mechanical solution is the installation of a stilling well. This is a vertical pipe (PVC or Stainless Steel) extending from the sensor mounting to the bottom of the tank. The pipe isolates a column of liquid from the agitation of the tank. Foam is excluded from the pipe interior (provided the bottom vent is below the foam line), allowing the sensor to measure a calm, foam-free liquid surface. Risk: Viscous liquids or solids can clog the pipe.
8.2 Frequency Selection: The Wavelength Advantage
For OEMs, selecting the right frequency is crucial. Standard 40-50 kHz ( mm) sensors are highly susceptible to Mie scattering. Lower frequency sensors (15-20 kHz, mm) have longer wavelengths that are less affected by small bubbles (shifting toward Rayleigh scattering) and have higher energy to penetrate light foam. Trade-off: Lower resolution and larger blanking zones.
8.3 Transducer Material Selection
For sensor manufacturers, choosing the right piezoelectric material influences performance in damping environments. **Hard PZT (e.g., PZT-4/8)** offers high power density and low dielectric loss, ideal for generating high-energy bursts to punch through attenuation. Optimization of matching layers and using hydrophobic faces (PVDF/Teflon) prevents wet foam adhesion.
8.4 Algorithmic Tuning
Techniques include mapping the tank when empty to teach the sensor static obstacles, and configuring "Echo Confidence Filters" to ignore momentary Loss of Echo faults or use "Hold Last Value" logic for short durations (e.g., 30s) to ride out transient foaming events.
9. Conclusion: The Limits of Physics
The failure of ultrasonic sensors in foamy liquids is not a defect of the device; it is a predictable consequence of acoustic physics. Foam is a material uniquely engineered by nature to absorb and scatter sound. Through impedance mismatching, Minnaert resonance, and geometric scattering, it prevents signal entry, dissipates energy, and destroys coherence.
For the automation engineer, foam should act as an immediate red flag for ultrasonic specifications. While mitigation strategies exist, the definitive guidance is clear:
- For Light/Dry Foam: Ultrasound will likely experience Loss of Echo. Radar is superior.
- For Heavy/Wet Foam: Ultrasound will likely measure the foam height (False Level). Hydrostatic pressure sensors are the reliable alternative.
Understanding these physical boundaries allows engineers to design systems that are robust, appropriate, and reliable, moving from a "trial and error" approach to one grounded in the fundamental principles of wave propagation.
10. Glossary of Terms
A measure of opposition to acoustic flow, defined as . The mismatch in determines reflection.
The loss of energy as a wave propagates, typically measured in dB/cm.
The fundamental volumetric resonance frequency of a gas bubble in liquid.
Scattering of waves by particles comparable in size to the wavelength.
Related Technical Resources
Use these internal references to compare geometry, material selection, reliability testing, and sourcing decisions.
- Piezoelectric Tube Products
- Piezoelectric Material Selection Guide
- Contact the Engineering Team
- Spherically Curved Piezoelectric Ceramics: Practical Introduction
- How Bowl-Shaped Piezo Ceramics Focus Ultrasound
- Spherical Cap vs Hemispherical Piezo Ceramics
- When Not to Use Focused Piezoelectric Ceramics
- How to Choose Radius of Curvature for Focused Piezo Ceramics
Engineering decision notes
Ultrasonic sensing and detection
Use this article when sensor performance depends on target distance, beam angle, housing material, liquid behavior, or false echo control. For "The Acoustic Void: Engineering Reliability in Ultrasonic Level Sensing Amidst Complex M...", the practical value is in turning the topic into a measurable selection or sourcing decision.
YJ Piezo treats ultrasonic sensing as an acoustic interface problem: transducer frequency, beam shape, housing, drive electronics, and target environment are reviewed together.
Selection checks
- Define target range, dead zone, beam angle, and mounting geometry before choosing the sensor family.
- Check the medium, target surface, temperature swing, foam, vapor, and side-wall risk.
- Separate detection repeatability from ideal lab accuracy when the sensor will operate in a tank, tube, or moving line.
Failure risks
- A sensor can pass bench distance tests and still fail in tanks with foam, agitation, vapor, or narrow geometry.
- Changing only frequency without reviewing beam angle and mounting can increase false echoes.
- Ignoring housing material or sealing requirements can shorten lifetime in washdown or chemical environments.
RFQ details
- What is the minimum and maximum detection distance?
- Is the target liquid, solid, sheet material, air flow, or a moving object?
- What temperature, humidity, IP rating, and output signal does the system require?
Relevant YJ Piezo pages
- Ultrasonic Sensors
Distance, level, and detection sensor portfolio
- Flow Measurement Transducers
Bubble and flow-related ultrasonic sensing paths
- Air Acoustic Transducers
Air-coupled transducers for range and presence detection
Application FAQ
- What makes an ultrasonic sensor page useful for procurement?
- It should connect range, beam angle, output signal, housing, mounting, and environmental limits to a concrete use case. A model name alone is not enough for reliable supplier comparison.
- Which information speeds up an ultrasonic sensor RFQ?
- Send the target material, distance range, installation geometry, output interface, temperature range, IP rating, and whether the application involves foam, vapor, liquid, or moving objects.